ScikitEDS: a visualization tool for monitoring the flow of sick patients
Date:
Changed on 25/05/2020

At the beginning of March, the AP-HP via its “Entrepôt de données de santé (EDS in French, means health data warehouse)” within its IT department launched a call for volunteers with solid skills in data science and machine learning. The objective? Analyzing, quantifying, predicting and visualizing daily clinical data related to Covid-19. The produced reports needed to be shared with the AP-HP management team on a daily basis. The EDS-COVID database contains the pseudonymized data of all patients who have taken a PCR test within the AP-HP (biology, medical history, demographics, medical reports, imaging...).
To date, more than 100,000 patients are in this database.
If EDS had the IT expertise to collect the data and the medical expertise to interpret them, it lacked the data science experts (statistics, visualization, modeling) to optimize the treatment. Dr. Alexandre Gramfort first visited the IT department to clarify the issues and needs. Then, engineers from the Scikit-Learn consortium (Olivier Grisel, Guillaume Lemaitre); engineers and researchers from the Parietal team (Inria Saclay - Gael Varoquaux, Thomas Moreau, Demian Wassermann, Alexandre Gramfort); SequeL team (Inria Lille - Jill-Jênn Vie); Zenith team (Montpellier - Julien Champ); and from the experimentation and development department of the Inria centre in Paris (Loic Estève) have joined to support AP-HP in the processing of data from the crisis.
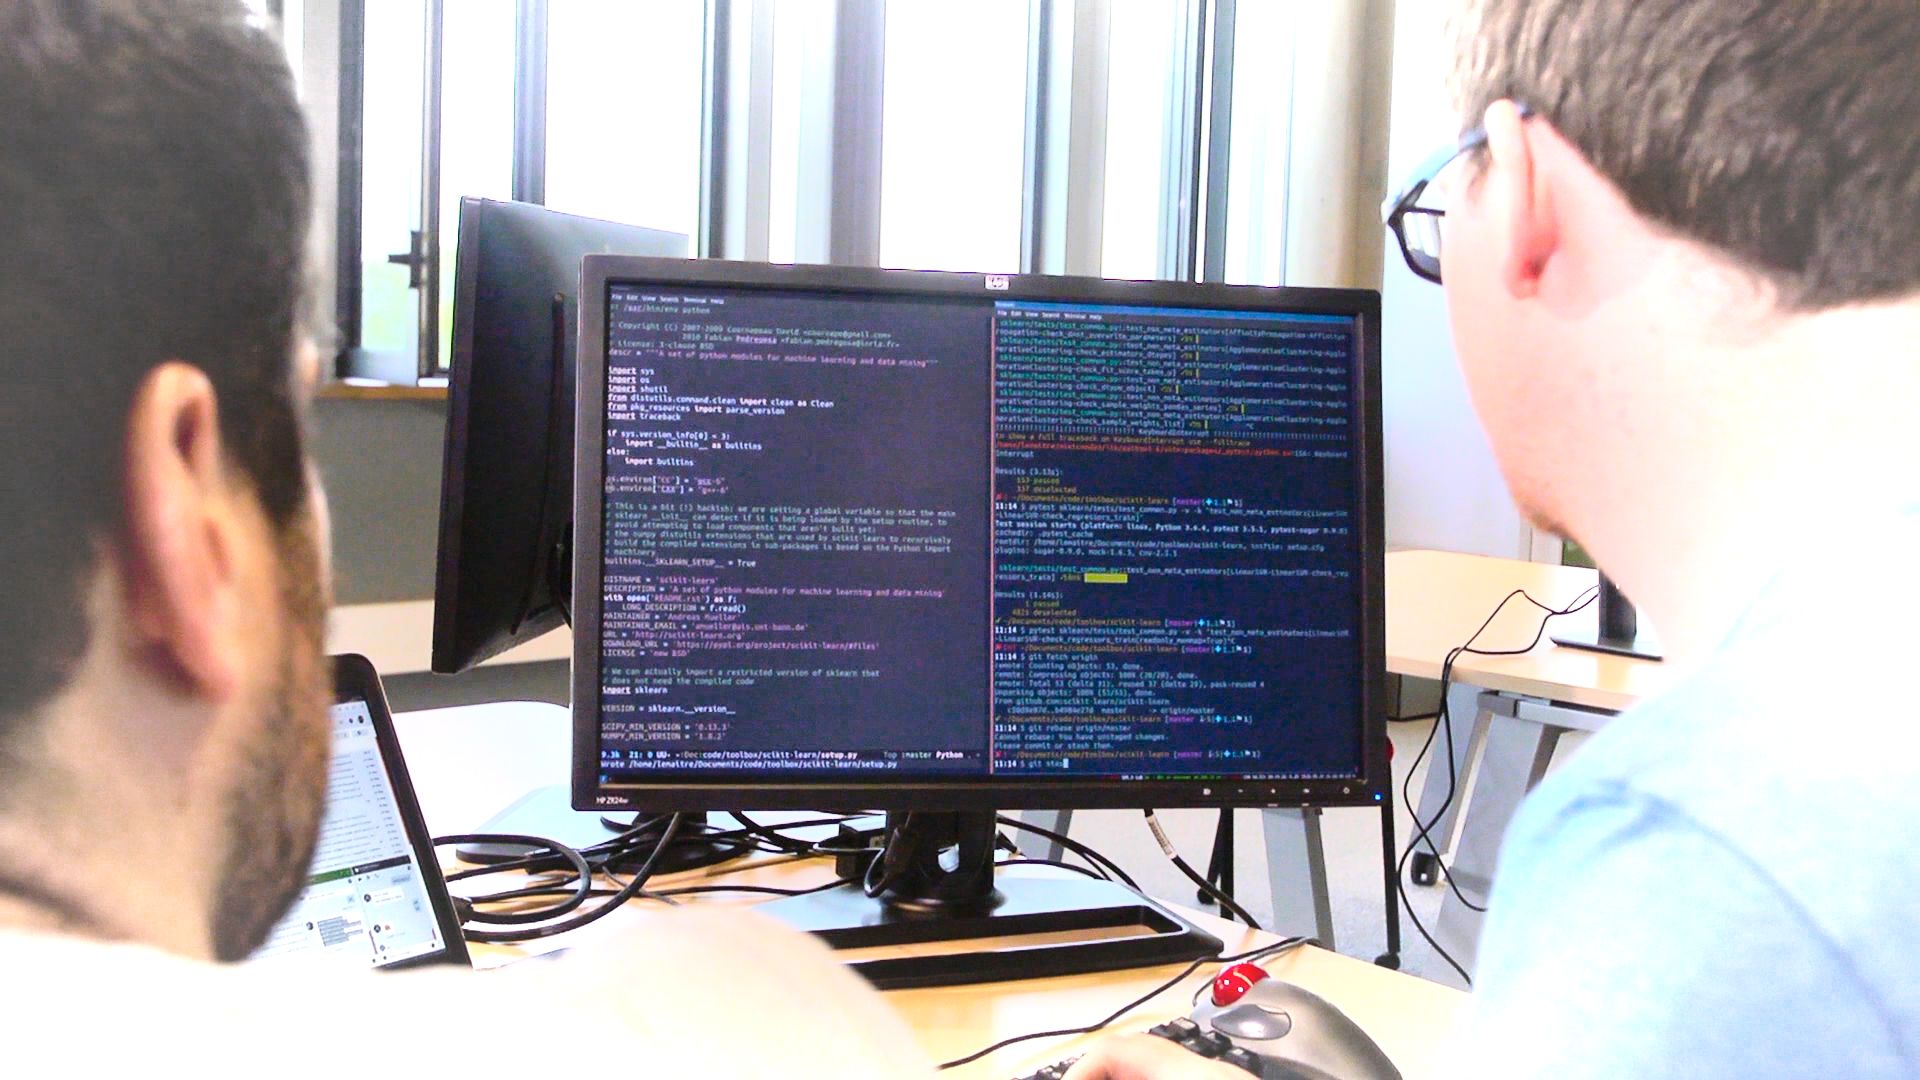
Since March 20th, this team of 9 Inria scientists has been developing software, mainly in Python, to facilitate the operational crisis management of the AP-HP's healthcare staff. This work is really at the interface between IT and medicine, with a lot of effort put into explaining concepts and medical IT codes for reporting.
Project holder : Alexandre Gramfort (EPC Parietal)
Partner: AP-HP
#MachineLearning #visualization #datascience
The team is developing a software stack for the deployment of a web dashboard for visualizing EDS-COVID data: demographics, hospitalization statistics including length of stay, risk factors and comorbidities, impact of drug prescriptions.
This dashboard is automatically generated from daily hospital database extractions, and was initially geared towards the AP-HP management. Since May 17, it is available to all AP-HP healthcare staff.
One of the elements produced by the software is a synthetic table containing for each patient more than 200 descriptive variables. This table can then be used directly for research.
The AP-HP gives us access to all the data in the EDS-COVID database via its Jupyter portal, which makes remote and secure access possible. We provide the EDS with software building blocks: a Python library that facilitates work on SQL databases and a data quality monitoring tool that simplifies the identification of quality problems (data entry or cross-referencing problems for example). One of the greatest difficulties of this project lies in managing the heterogeneity of data sources (variability of software tools, different data formats, missing data).
The largest challenge of this project was to work in a collective way. Mainly due to the diverse background and working habits of the numerous actors involved. This is why, during the development phase of the EDS-COVID task force, we had twice-daily, then daily, exchanges with the doctors: we could thus check the quality of the visualizations and data almost in real time.
Subsequently, we continued the discussion in the form of more specific working groups (survival models to estimate the median length of stay in intensive care, geographical origin of patients, impact of comorbidities such as obesity on disease progression), with constant dialogue between doctors and Inria scientists.
ScikitEDS, the fruit of this work lasting several intense weeks, is now used in dozens of research projects across the AP-HP.
The team's work uses a lot of free software: Jupyter, PostgreSQL, the PyData ecosystem with Pandas, Matplotlib, scikit-learn or Plotly. Project management is done via GitLab as well as the integration and continuous deployment of results via GitLab CI/CD and GitLab Pages. We use Zulip as a discussion platform for hundreds of collaborators.