Xavier Pennec, a virtuoso of geometric statistics in the service of health
Date:
Changed on 22/10/2024

The principle: we start with an object that appears to be in a “classical” Euclidean space, but when we want to perform an analysis that doesn't depend nor on its position or orientation in space. My job is to redefine the usual statistical notions so that they work properly on these geometric spaces.
We can then model data in the life sciences, in particular to analyze biological variability in organ shape over time. This is what we call computational anatomy, an emerging discipline at the frontiers of geometry, statistics, image analysis and medicine.
In the 1990s, to study two brains, the similarities and differences in the images were analyzed after superimposing them as best as possible by rotation and translation, a method of vital importance to medical imaging known as image registration. In the 2000s, methods evolved to include deformation-based registration, enabling images to be superimposed almost perfectly. The statistical analysis of image similarities and differences was then transferred to the transformations themselves. But to observe these infinite-dimensional deformations in a stable way, it was necessary to identify the underlying geometric structures to be respected in order to add sufficient constraints. For example, the diffeomorphism group structure provides a way to better model deformations, while guaranteeing object properties through geometric statistics.
Because diffeomorphic transformations offer better prediction and a better control of the biological variability, all medical professionals In the MICCAI (Medical Image Computing and Computer Assisted Intervention) scientific community have understood the value of these methods and are committed to their use.
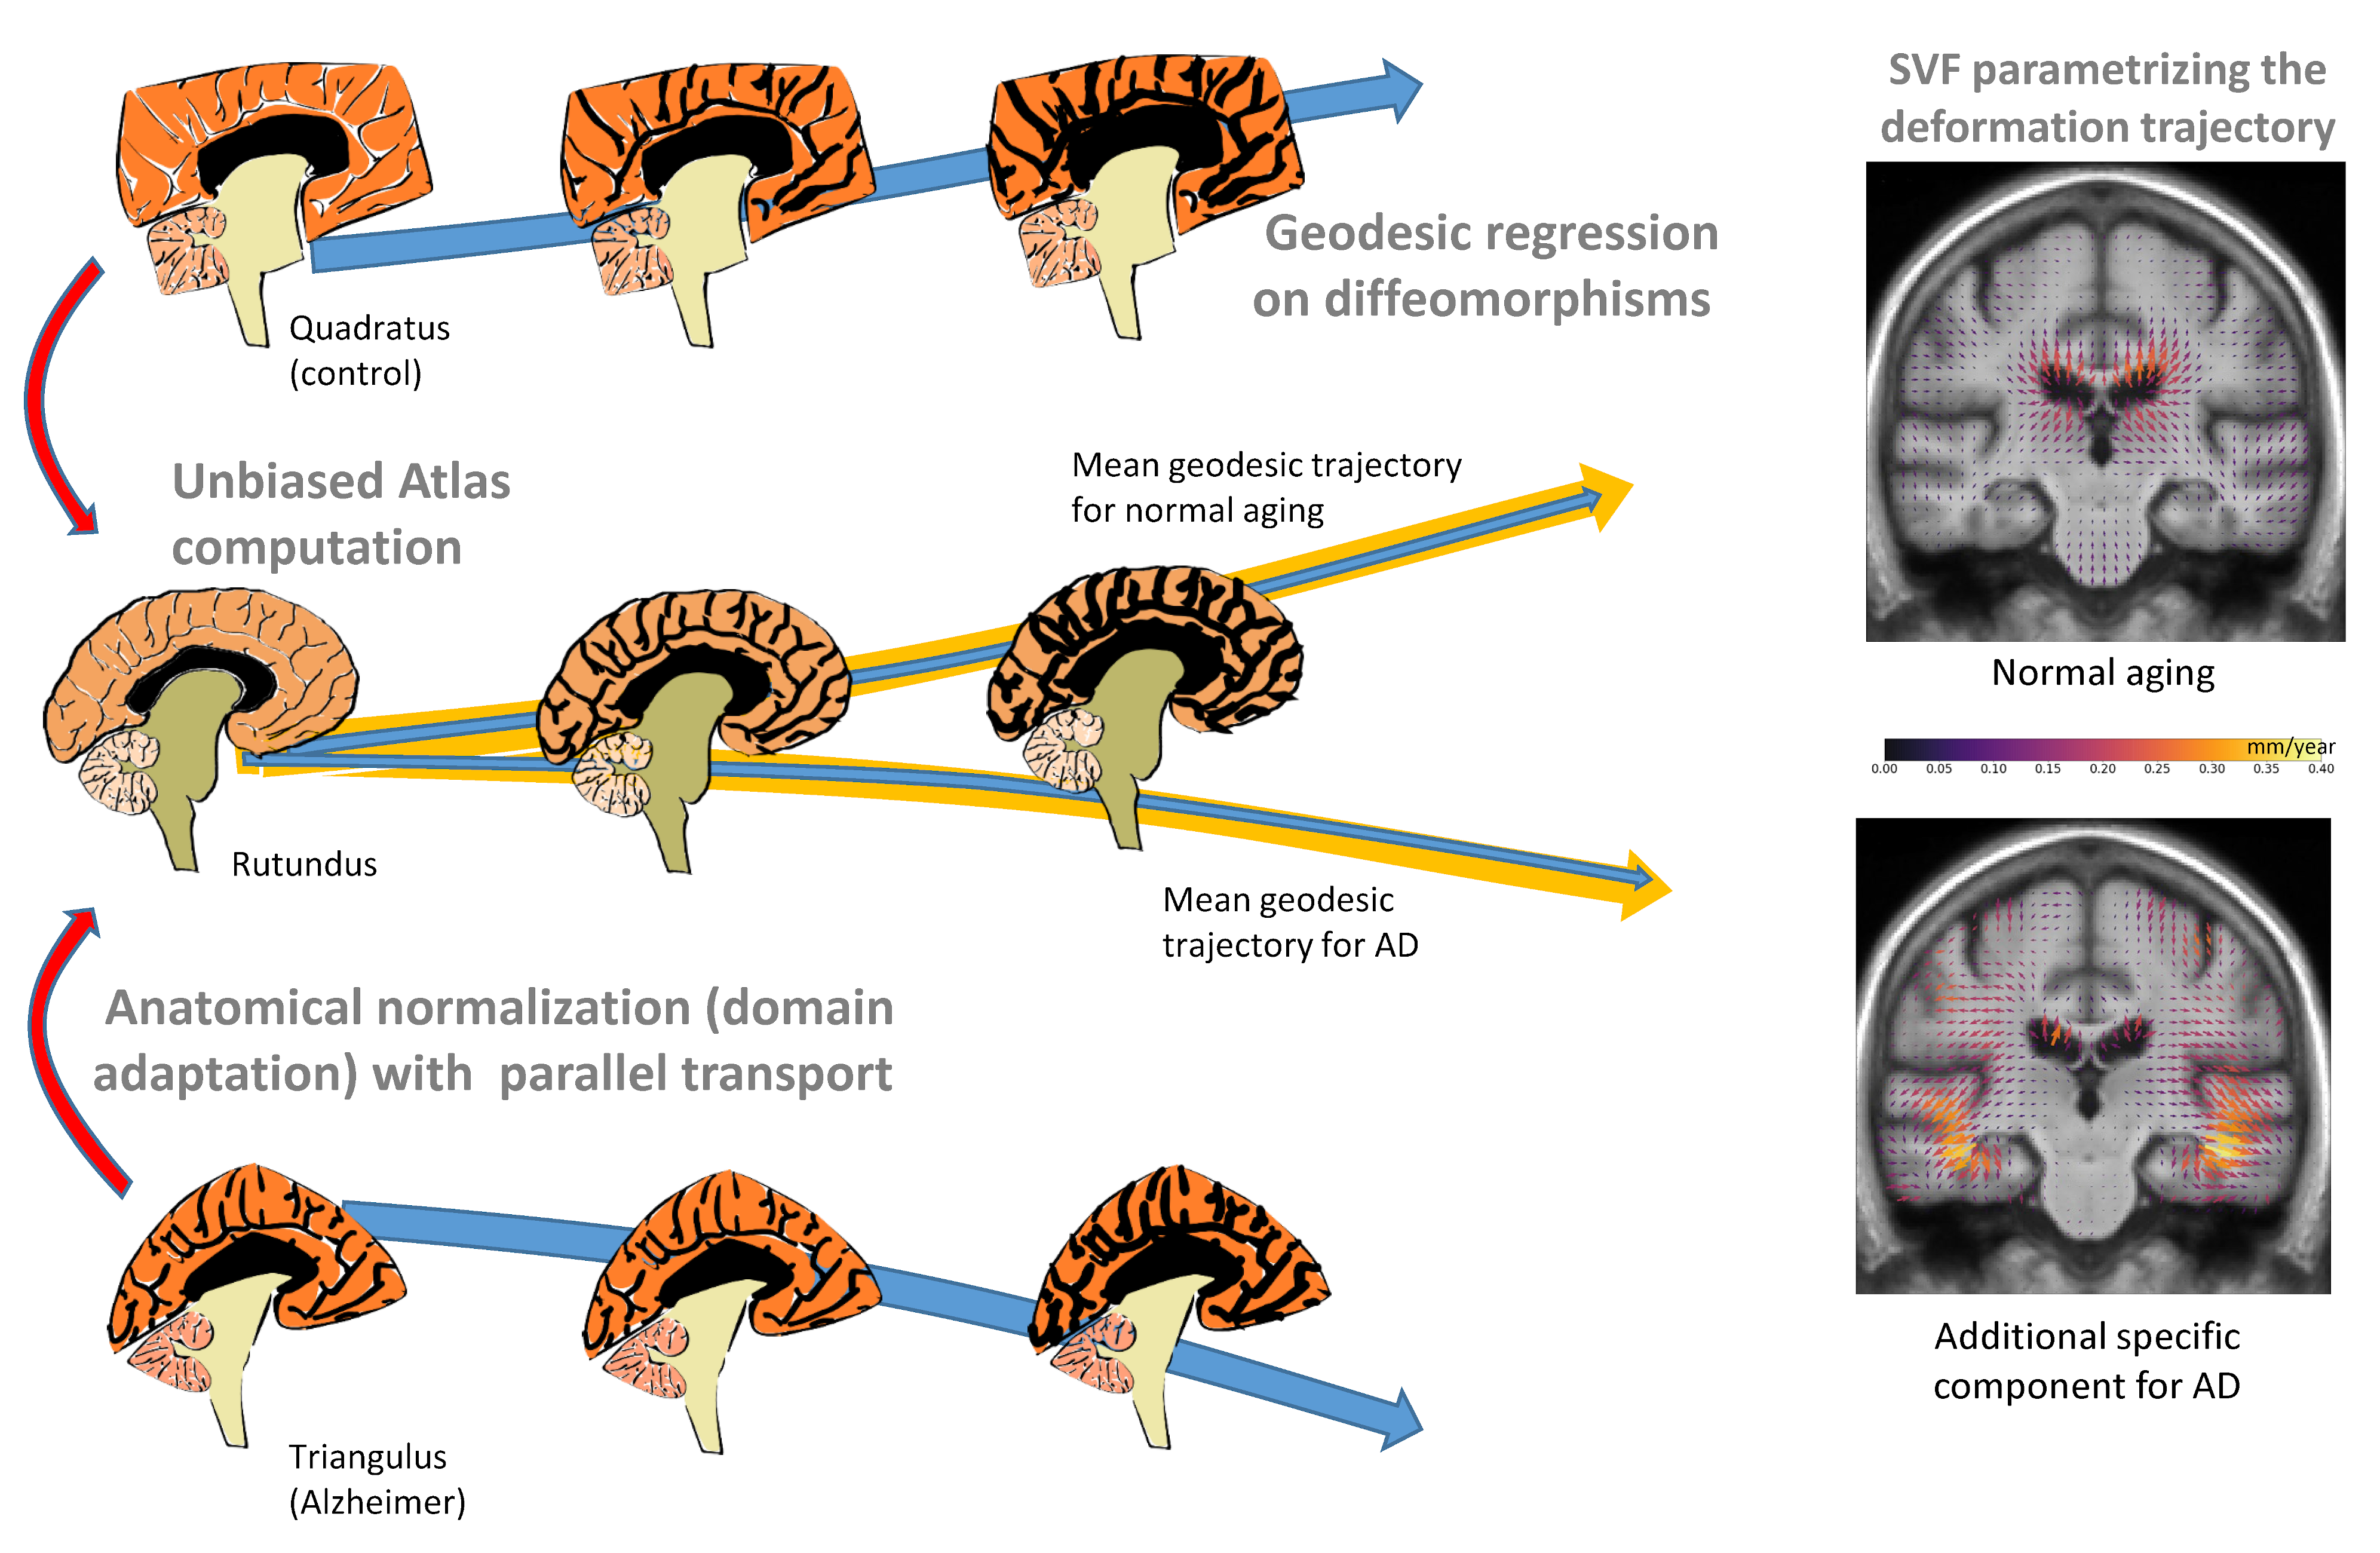
For example, we used it to study the brains of people suffering from Alzheimer's disease. We had images collected at one-year intervals and we estimated the deformation over this period for each subject. We also had to compare the subjects with each other, which required a method for adapting the deformation of each subject. Thanks to geometry, we were able to establish an average deformation trajectory from a reference anatomy, modeled by a geodesic in the space of deformations, a notion that generalizes the straight line in curved spaces. We then extrapolated along the geodesic to model the evolution of the brain seven years before and seven years after. In this way, we can compare a young brain with a very old brain suffering from Alzheimer's disease. Our modeling continues to resemble a plausible brain, with no obvious aberrations. We don't exactly match reality, but we're getting close.
We've also used these techniques for studies on scoliosis: we've modeled the relative variability of each vertebra with respect to its neigbors. By computing our geometric mean, we were able to reconstruct an “average” shape of the spine. But more importantly, we were able to visualize the most typical variations and understand them anatomically. Our statistical models thus enable description and prediction, while improving interpretation.
Our difficulty is that we are observing living elements, which are subject to an extreme variability. And what we're aiming for is the minimum structure that enables us to best approximate the geometry of all the data. Admittedly, our very simple statistical models are not exact, but the important thing is that they are sufficiently explanatory and predictive.
In the life sciences, our approximations can provide a wealth of information where data is lacking. In the medical field, scientists sometimes study only one pathology, or a very specific sub-pathology, with barely 10 or 100 data at their disposal, which is very little. Geometry can provide the missing prior information to both correctly describe the data and plausibly interpolate between them in order to better estimate or predict.
This is one of the most attractive forms of funding for basic research. Thanks to this support, we can think far ahead and propose topics that don't have concrete applications yet. This hindsight enables us to devise new ways of approaching problems that we can't think of when we stay too close to practical issues. As a result, many scientific breakthroughs may be achieved, leading to radically new applications that are developed much later.
So I was able to recruit a whole dedicated team and build a rigorous mathematical framework around geometric statistics, to find out what works, in what context, etc... Now, with this knowledge acquired during five years of more theoretical research, my team and I can return to the data and applications with greater relevance. Today, we are developing new methodologies and identifying the limits of what we can achieve. And there are still new territories to explore thanks to this geometric vision!

Director of research - Epione
2004, route des Lucioles
,
06560 Valbonne Sophia Antipolis